


How-to animate
As previously said, PowerPoint animation tool is a powerful way for attracting and even entertaining your audience. But, most importantly, advanced PowerPoint animation allows you to direct the path of your presentation and how its story unfolds.
More complex animation examples are shown in this section. Namely, the first is animated diagram, the second – animated map.
Important note!
More basic information on PowerPoint animation you can find in our previous article with a truly mysterious name, PowerPoint Animation Basics.
In your search for other ways to handle various media in PowerPoint, you might like other articles of our blog, particularly, Christmas Сard and PowerPoint, How to insert audio in PowerPoint and GIF Marketing. GIF, Marketing and Marketeers.
Dynamic data presentation
Of course, you may put your diagram on a slide and go over it all at once. However, as previously stated, we would like to have some control over how things progress. So, let’s practice some stunts.
To begin with our PowerPoint animations, set your chart on the slide. We must now decide how to present our data.
Step 1
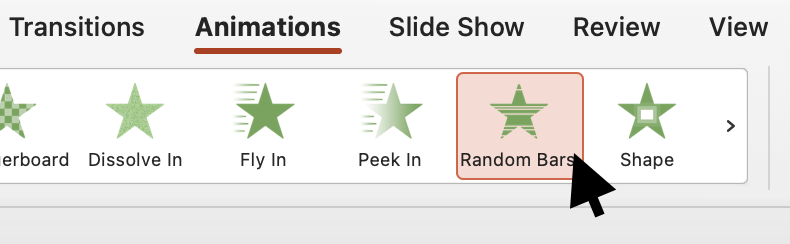
Choose the diagram you want to animate. Then, in the Animation menu, select the Entry animation you want.
Let’s look at Random Bars as an example.
Step 2
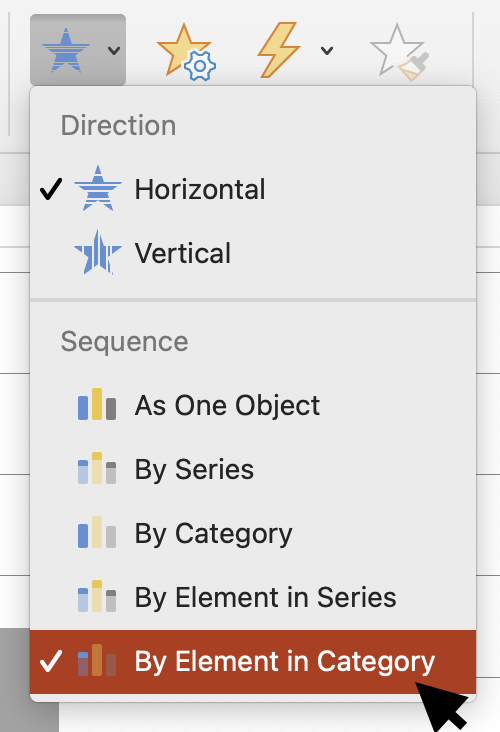
Effect Options determines the parameters of the specific effect. Remember that each effect has its own range of options. For Random Bars, we may specify the orientation (Horizontal or Vertical) as well as Sequence. The latter controls the sequence in which your graph bars appear. You may choose the item that appeals to you the most.
However, a comment is required – As One Object displays all of your chart’s elements together.
Step 3
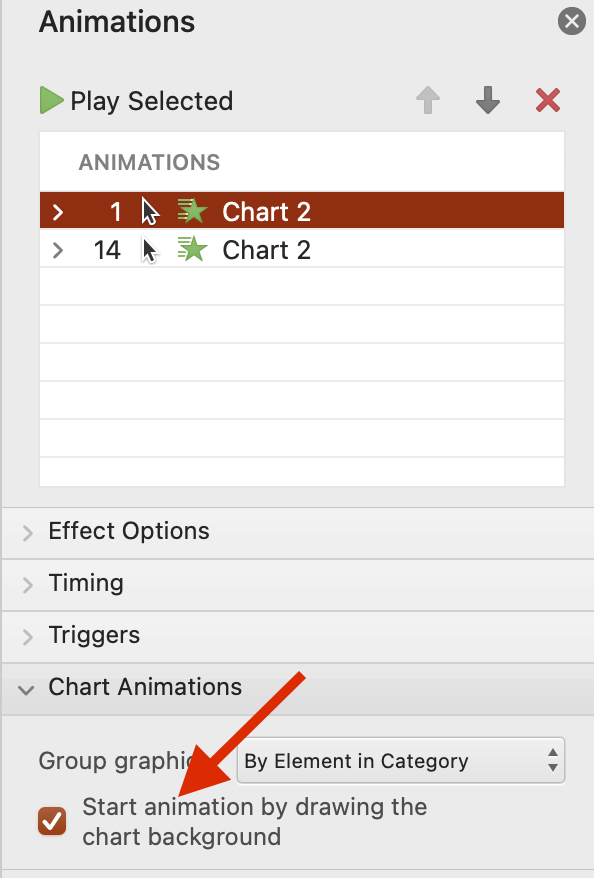
There is a check box in the Animation Pane under Chart Animations called Start animation by drawing the chart background. When this option is selected, your chart’s background is hidden and appears with the first animation.
Step 4
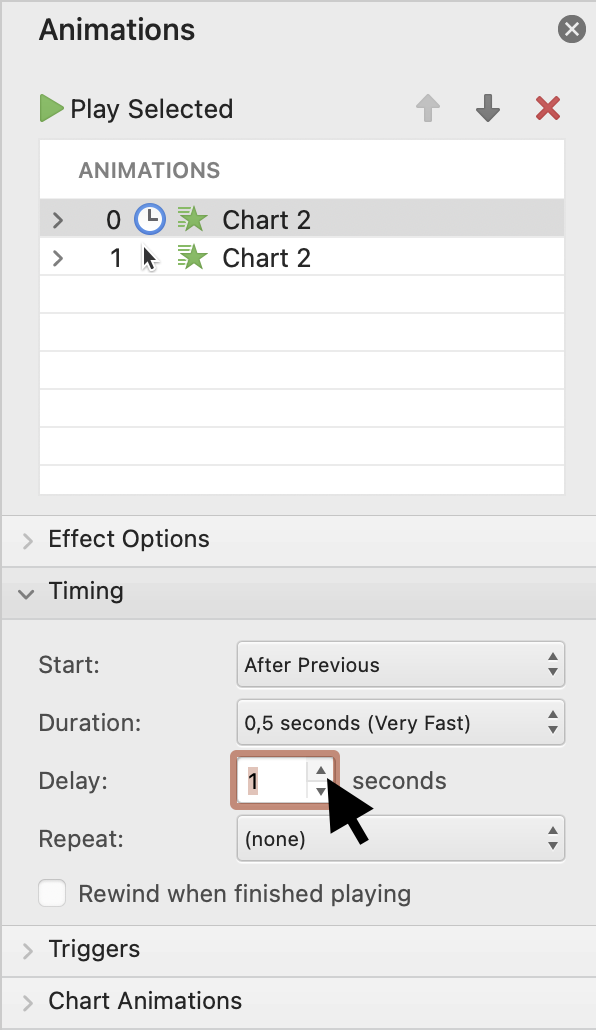
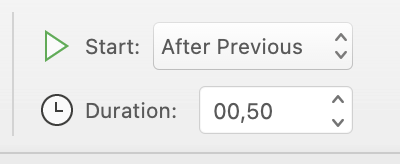
You must now specify how your chart will be displayed. To display my chart automatically, I’ll set Start as After Previous with 0.5 Duration and 1.0 Delay. Otherwise, you can set Start as On Click to correlate the way columns appear with your speech and boost audience focus.
Animation check
Let’s have a look at our final animation.

Maps and animation
This example is more sophisticated PowerPoint animation and will necessitate more effort on your part. But, as you’ll see, the end product is extremely cool.
Step 1
As a background, take a global map. You might either find one in the Internet or use one from Charts (Insert – Chart – Maps – Filled Map).
Step 2
We are now going to make our first map tag. It will also serve as a model for future tags.
- Place a Teardrop object on the chosen map spot (Insert – Shapes – Basic Shapes). Turn its bottom to point to the location you require.
- Use Appear and set the Timing – Start to After Previous.
- Place an Oval object on our Teardrop (Insert – Shapes – Basic Shapes). Set its background to Solid fill with white, and widen its boundaries to be close to the Teardrop ones.
- Select Fly-in from the Effect Options and set the Timing – Start to After Previous.
- Insert the Main Text field (Insert – Text box) with a solid fill white background, separating line 1 (Insert – Shapes – Lines), the Comment field (Insert – Text box) with a solid fill white background, separating line 2 (Insert – Shapes – Lines), and the Count field (Insert – Text box) with a solid fill white background in that particular order.
- You need also change the color of your text and separator to Teardrop ones (if you feel like that, of course).
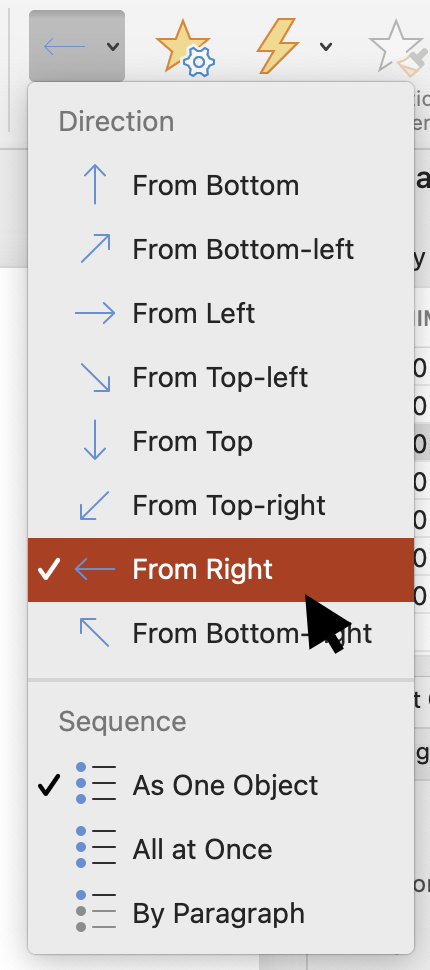
In the Animations menu, apply Fly-in (From Right or From Left, in alternating order) in the Effect Options and After Previous in Timing – Start to all newly inserted items.
Step 3
There is no need to construct more markers from scratch once our template is complete. We can paste our first Teardrop element into additional places. It makes sense to use a separate background color for the teardrop, text fields, and separators.
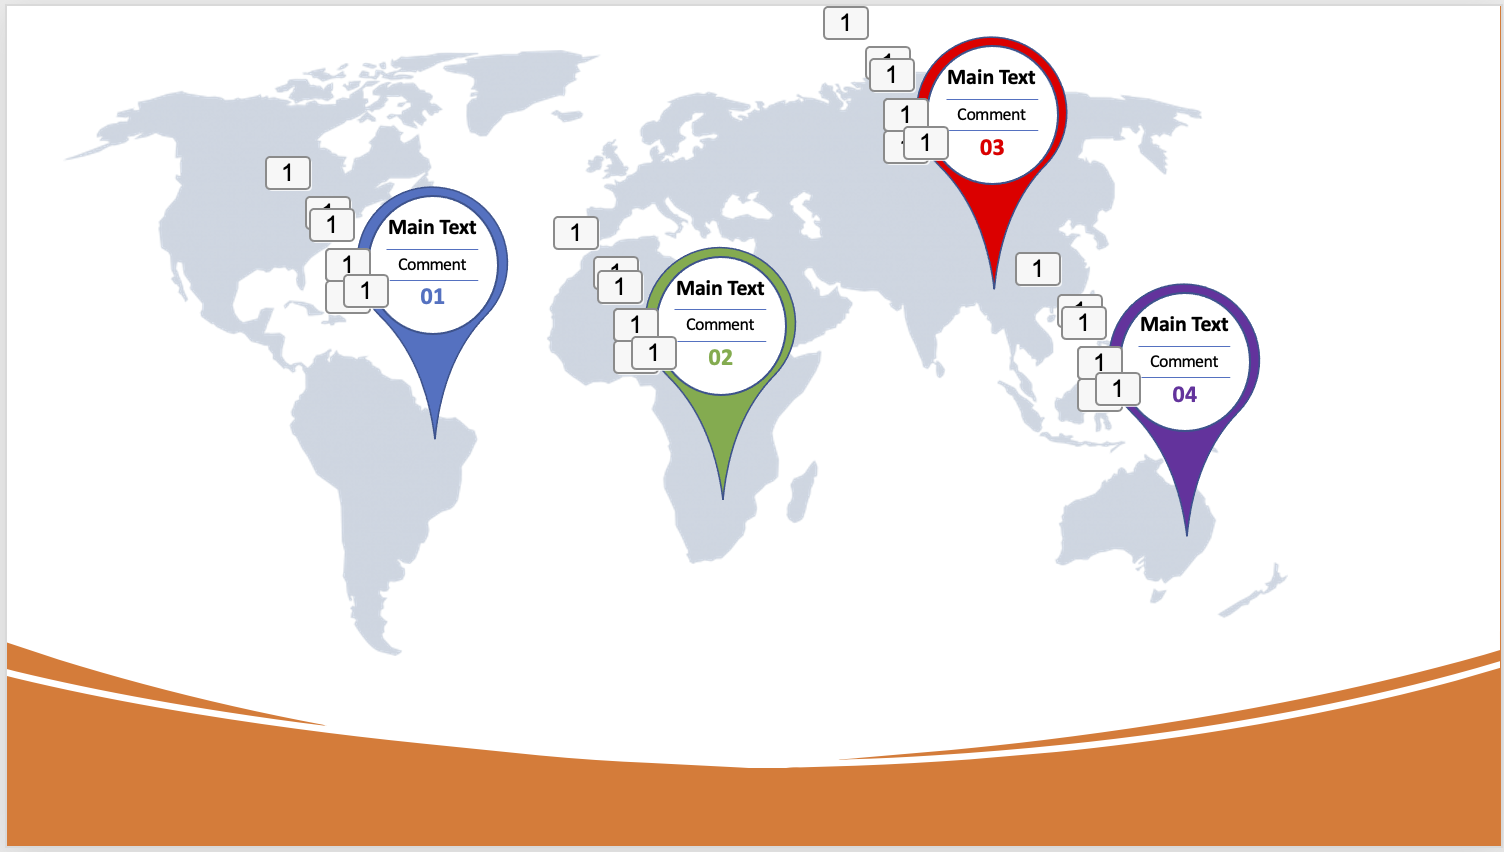
Animation check
Your animated map is now ready for display.

Final notes
As you can see, animations are not difficult to execute and produce rather spectacular results. Of course, it requires some time and talent, but it pays off in the end. Naturally, we’d want to move things along more quickly and quietly. Try the Aspose.Slides products – it’s a set of Aspose apps for handling PowerPoint slideshows (but they’re not the only ones these apps can help you with).